Optimizing for Success in Your Next Growth Round
By Scott Raney, Emily Man, Sai Senthilkumar, Adele Li
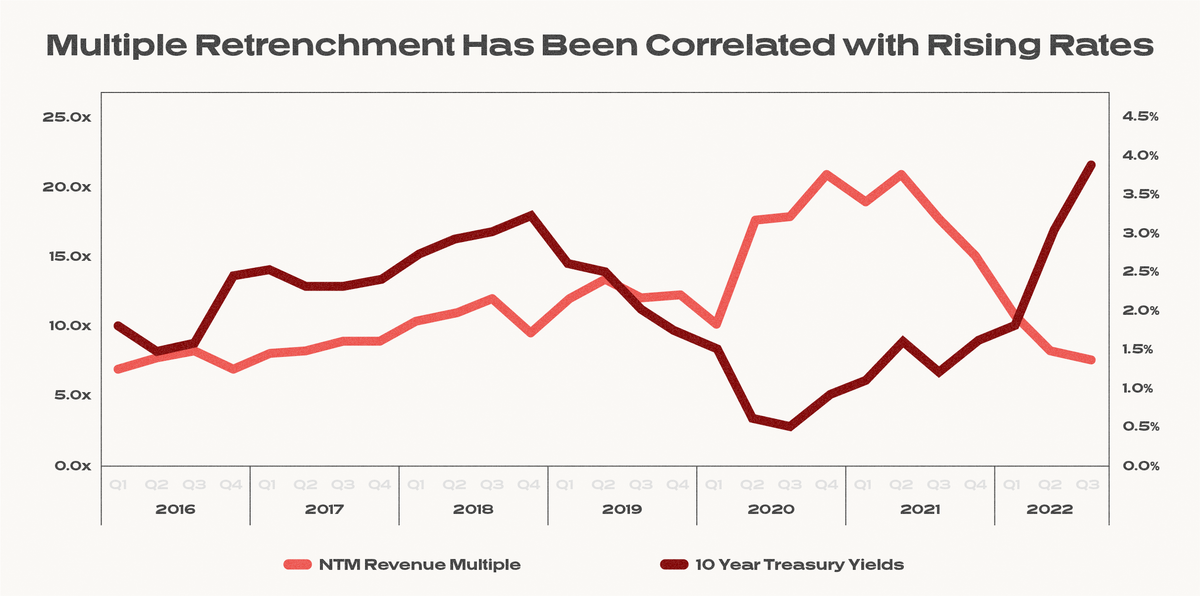
Inflation, rising interest rates, and geopolitical conflicts continue to pressure the public markets. Public cloud valuations have been slashed over the last several months; high-growth software businesses that were trading north of 50x forward revenue are a fraction of that today, with the average software business trading at 5x forward revenue. As the economy slows down, companies are taking steps to maximize the longevity of their businesses.
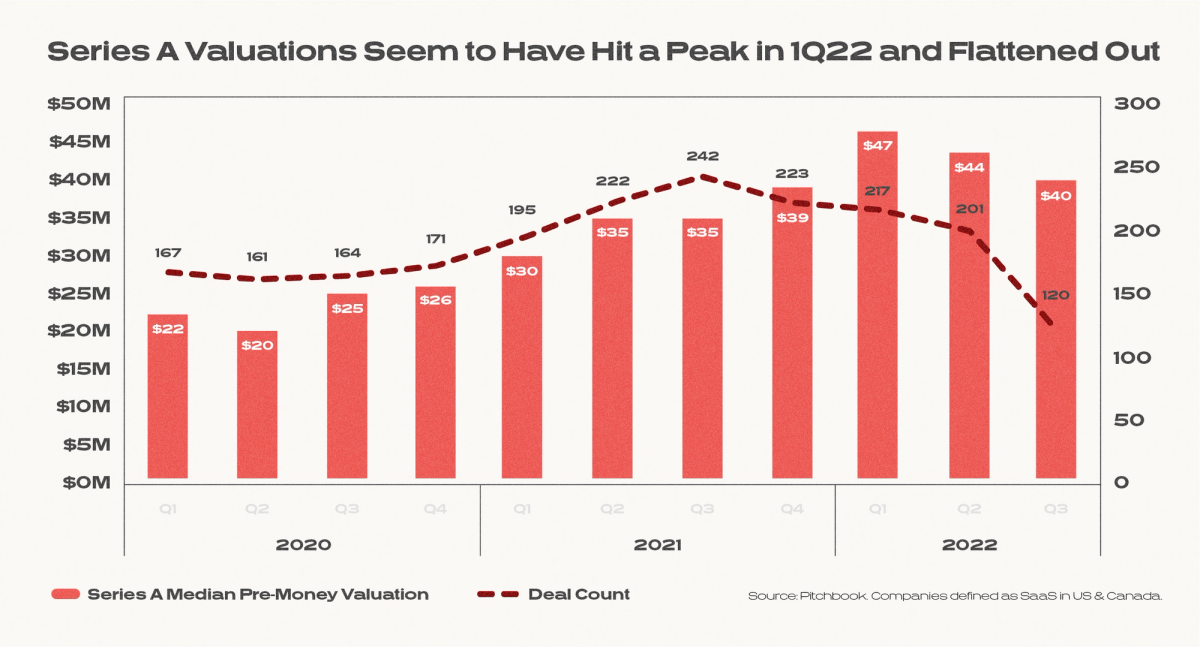
At the same time, the private markets in 2022 are a stark contrast to the frenzied deal-making we witnessed in 2021. Total venture dollars deployed in 2021 was a record $340B (that figure is expected to be 50% lower this year). More important, the number of deals only increased 25% in 2021, implying that a lot more dollars went into each deal. Many Series As were happening with little to no traction driven by ambitious visions. Series A valuations doubled from 2020 to 2022. Although the fundraising headlines were great, the intrinsic value of most early stage startups are years away from their reported valuations.
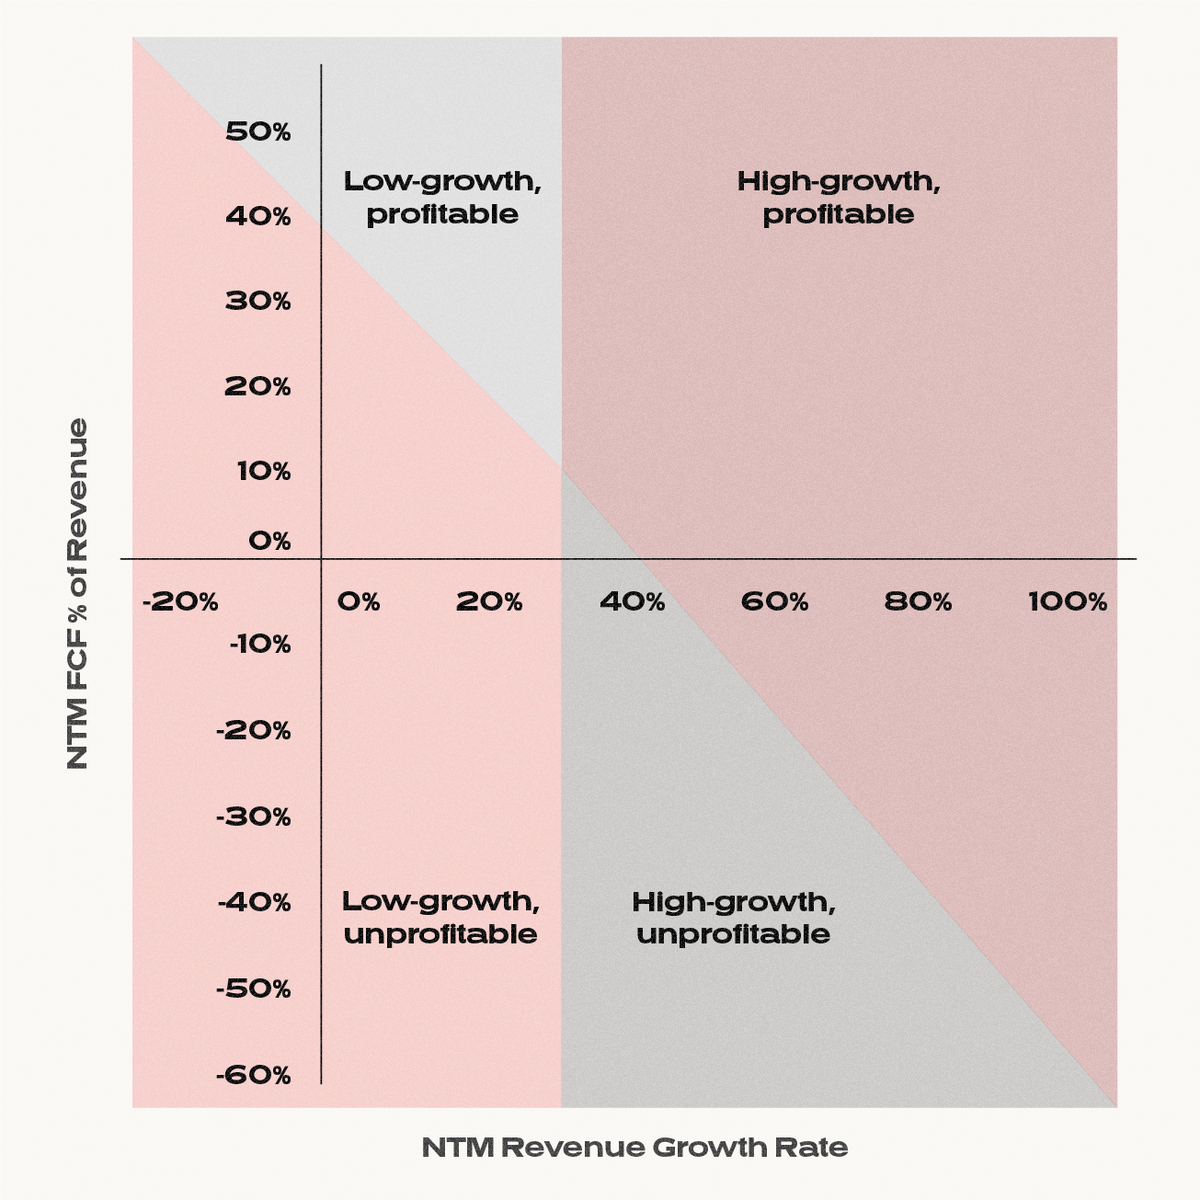
The public markets have clearly spoken —efficiency (and profitability) is king. Segmenting public software companies by rule of 40 (NTM Revenue Growth Rate + NTM Free Cash Flow Margin) and revenue profile (high growth defined as >30% and low growth as <30%) yielded four distinct business profiles:
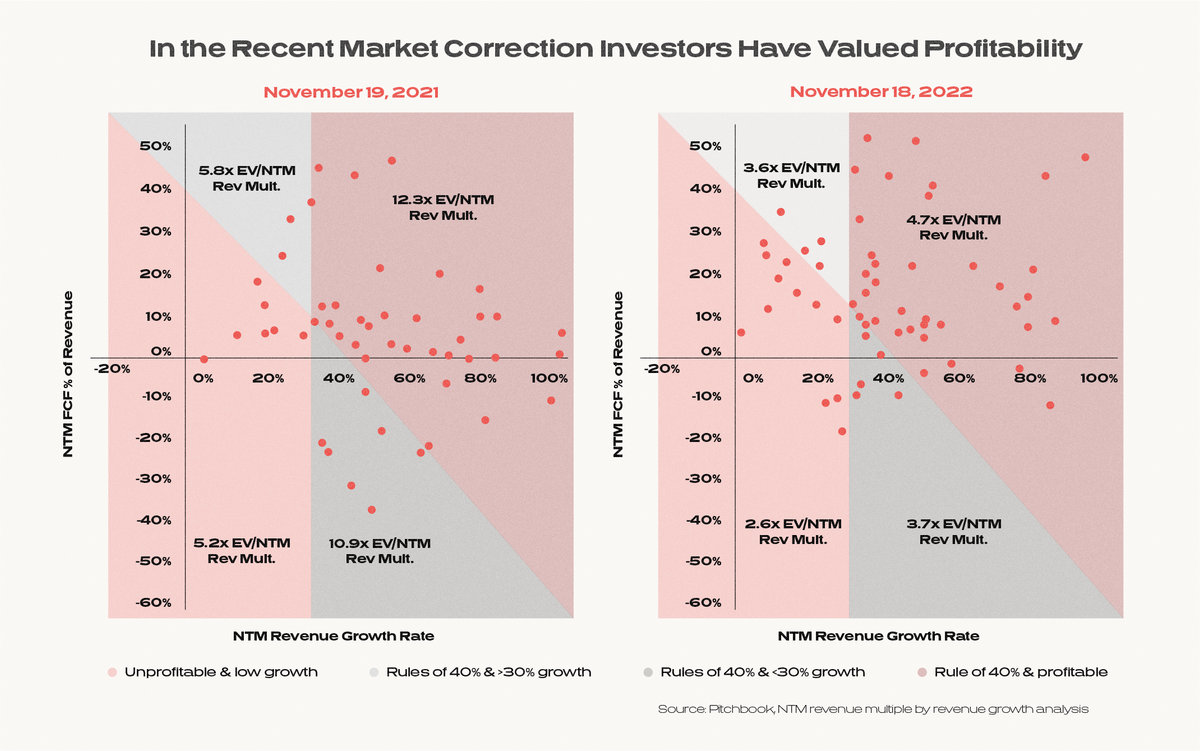
In the market correction, we see that unprofitable companies regardless of growth rate have been the most harshly re-rated. In our analysis of public software companies, we found that between Nov 18, 2021 and Nov 19, 2022, unprofitable companies on average saw a 73% decline in share price. In comparison, profitable companies saw a smaller 51% decline. In particular, multiples for the high-growth unprofitable quadrant declined 66% in the last year, lowering from ~11x NTM to ~4x NTM. This decoupling of performance from growth shows that as capital has become more expensive, “growth at all costs” has gone out the window. Public market investors are rewarding sustainable, cash flow generating businesses.
Growth is Caught in the Middle
Growth investors are attempting to bridge the gap between early stage startups sitting at high valuations and what those companies would trade for in the public markets. As a result, we’re witnessing a massive squeeze within the growth investing markets, defined as Series B and up. According to Pitchbook data, growth dealmaking has taken a serious dip—total dollars deployed at the Series B / C has declined 67% from Q4 2021.
So what does this mean for current early stage companies looking to raise their growth rounds?
Well, in short, the bar is higher. As capital has become more expensive, there has been a reweighting towards profitability over growth, with the public markets penalizing high cash burn businesses that haven’t demonstrated improving unit economics. The messaging has shifted from growth at all costs to understanding and the sustainability of growth. Growth investors will not only be looking for best-in-class revenue growth, but even better underlying unit economics and cash burn profiles.So what does the sentiment shift of public market investors imply for growth stage startups? How have growth investor expectations changed? What will they be looking for in my next round? How are other startups currently reacting to this macro environment?
These are all questions that we’ve been consistently hearing from portfolio companies and founders across the ecosystem. To answer these, we ran a recent survey targeted at 50+ venture-backed startups that have raised between a Series A through Series D to better understand how teams are adjusting to this overall slowdown, and specifically understand how the best startups are adjusting and optimizing their businesses to set themselves up for success for future funding rounds.
The companies surveyed were split into two groups - “Off-Target'' and “On-Target” - based on self reported revenue progression so far this year. Companies were asked to evaluate their top-line performance relative to their original financial plan at the beginning of the year. Let’s see how each group compares.
Diving into the Data
Cash Burn Multiple Is the Core Measure of Efficiency
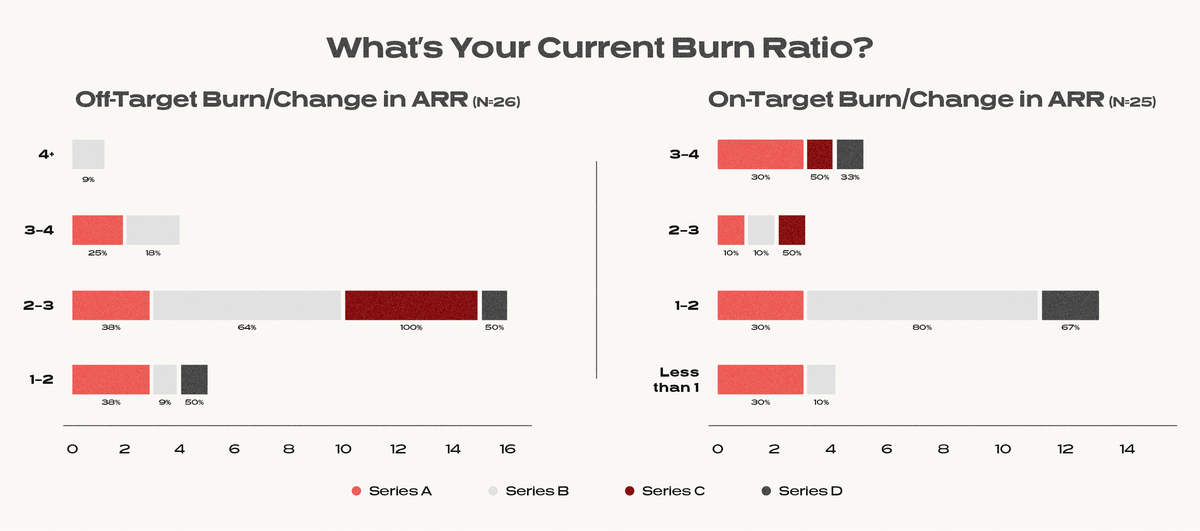
For high-growth tech companies, venture investors are not expecting to see profitability. However, the later stage a business is, the higher the expectation to show operating leverage and a path to profitability. Burn multiple (defined as burn divided by change in ARR) is a core metric that we track to measure efficiency in businesses.
Across the survey set, we found that best in class companies were carefully managing burn multiples. A 1-2x burn multiple is best-in-class; 2-3x is good, while 3x+ is inefficient. Companies performing on-target were on average better able to manage their burn multiples by one or two turns.
However, note that there is a distinct cohort of companies that are “on-target” but have 3-4x burn multiples. This is a telltale sign of “growth at all costs” where dollars are being spent at a rapid pace to sustain growth in the business. This is typically a sign of either lack of true product-market-fit or an intensely competitive market with “land grab” dynamics that has been propped up by the wide availability of cheap capital. This type of growth is unsustainable and we expect to quickly see which businesses are truly viable.
How are Startups Balancing Growth vs Efficiency?
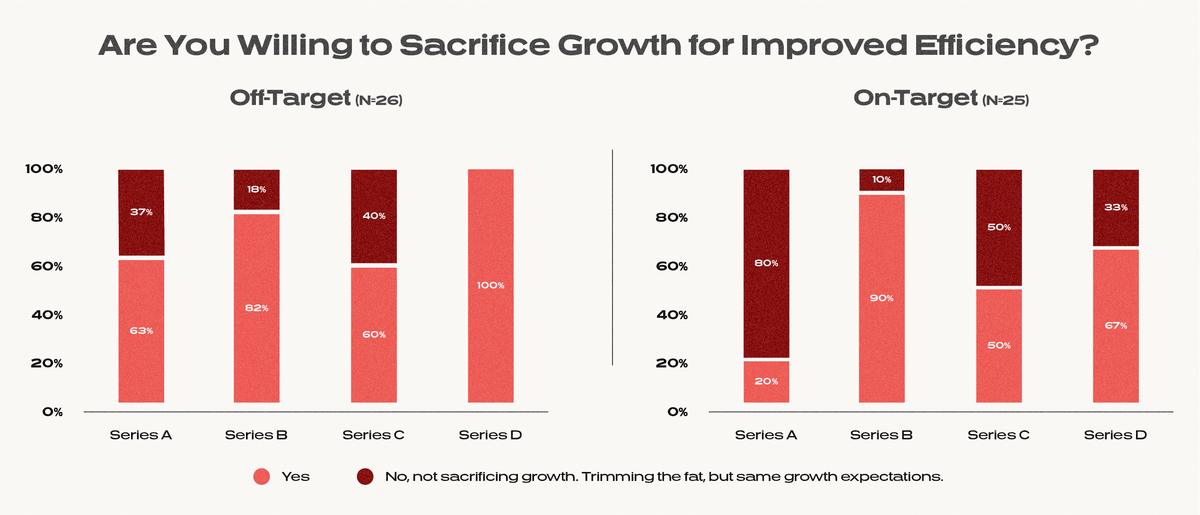
In response to this shift, private businesses are now also adjusting internal expectations for growth. Across our sample, companies across the board were willing to sacrifice growth for efficiency. While the companies that were still on-track to hit initial business goals were less likely to be revising down estimates, this suggests that most companies have realized they have to both cut burn and adjust growth expectations.
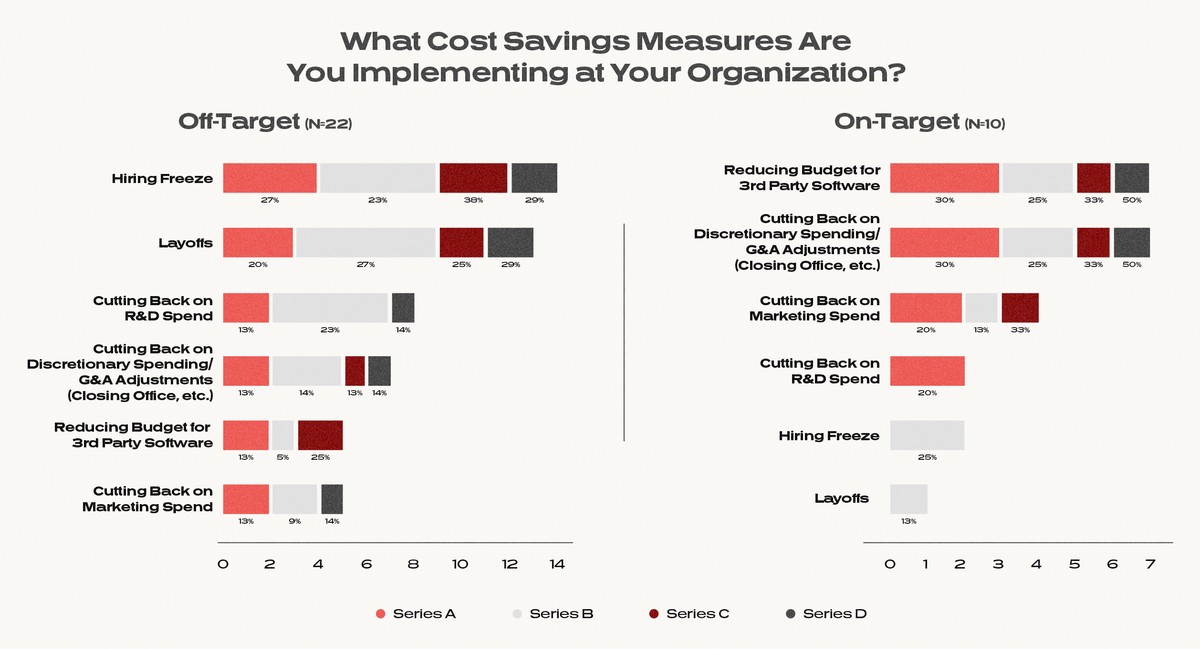
Cost Saving Strategies Depend on Performance
On average, businesses were looking to reduce burn by 14% relative to initial budgets. Based on performance, companies are adopting different cost savings strategies. A side-by-side comparison on-target vs. underperforming shows different approaches to reducing burn. Off-Target companies are choosing more personnel related cost cutting measures (e.g. hiring freeze / layoffs) while on-target companies are more focused on cutting spend at the fringes like third-party software or discretionary spending.
Consider Personnel Cost Management Strategies
Personnel costs are by far the largest line item in opex for startups. Within payroll, there are typically three strategies (of varying severities) available to control costs—hiring freezes, layoffs, and compensation adjustments.
Hiring Freezes
Hiring freezes come first. 40% of companies surveyed have already instituted a hiring freeze. However, this is primarily the case for underperforming businesses, which suggests that on-target companies are taking advantage of the environment to acquire strong talent.

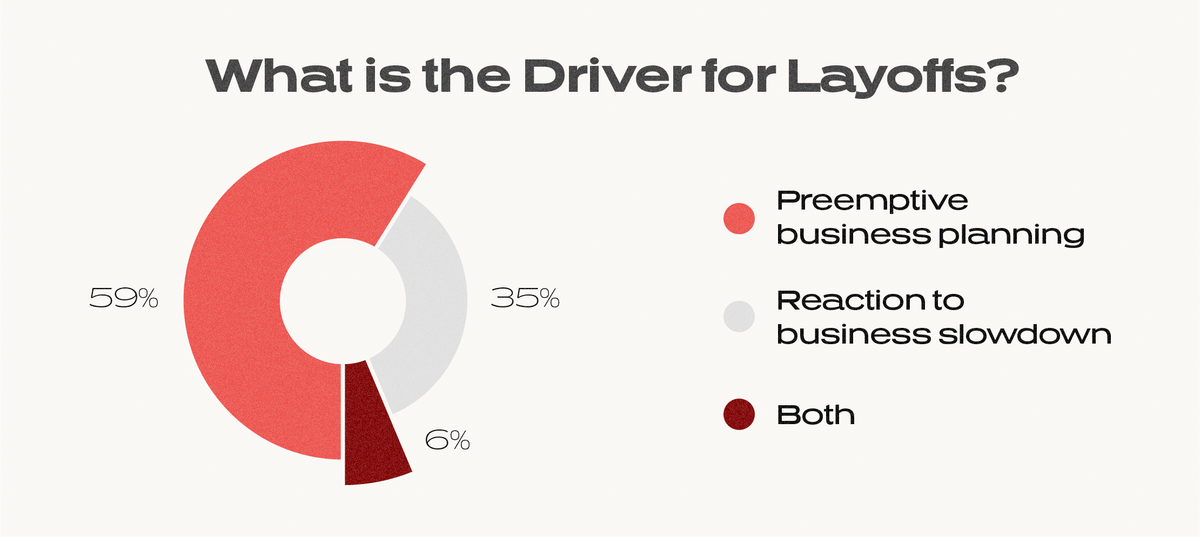
Layoffs
Layoffs have dominated headlines as of late. For companies that were planning on layoffs, we found that 60% were for pre-emptive business planning reasons (vs. as a reaction to business slowdown).
Compensation Changes
Across companies, 65% are not adjusting compensation that is being offered to new joiners while 27% have actually increased compensation in response to inflation. Of those 8% who are reducing compensation, this is primarily coming in the form of shifting the composition of packages away from cash and towards equity. These are a direct reflection of a tight labor market suggesting that employee compensation is not currently a lever that can be used to control burn.
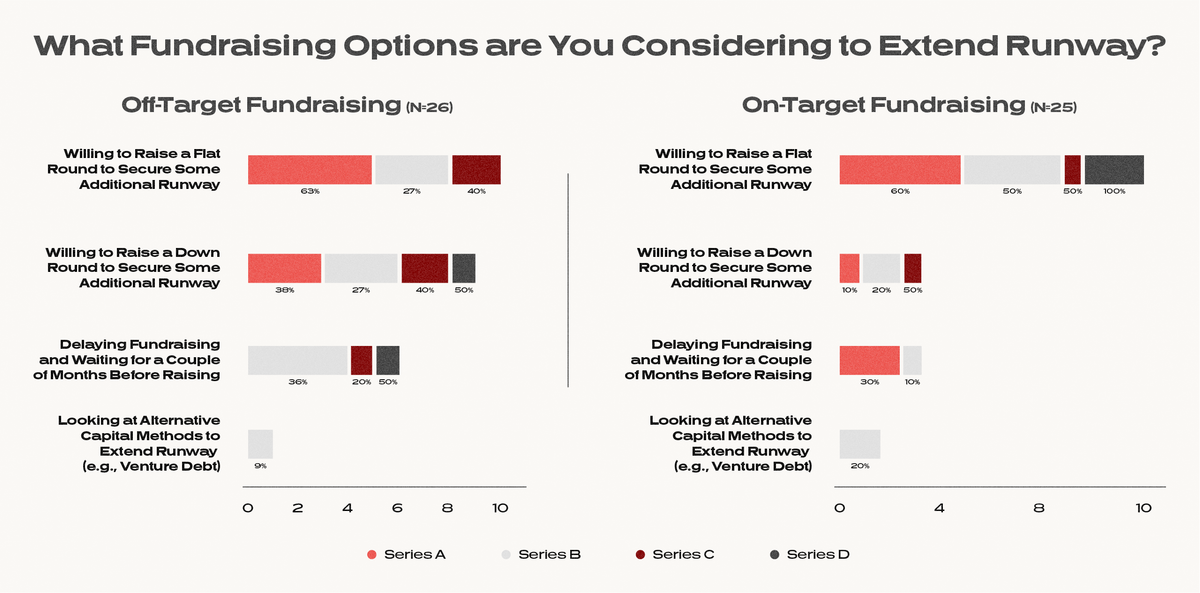
Don’t Run Out of Money—Runway and Fundraising Plans
Across the board, companies are largely well-capitalized. The average company is currently sitting on 12-24 months of runway. This suggests that companies benefited from last year’s bull market and high capital availability.
When it comes to fundraising plans, companies showed high receptivity to reopening the last round or raising an extension flat to the previous valuation in order to secure additional runway. Our data shows that 50% of companies across both buckets of performance were open to this option. Increasingly, we’ve seen receptivity to a down round to reset valuation to match the current environment.
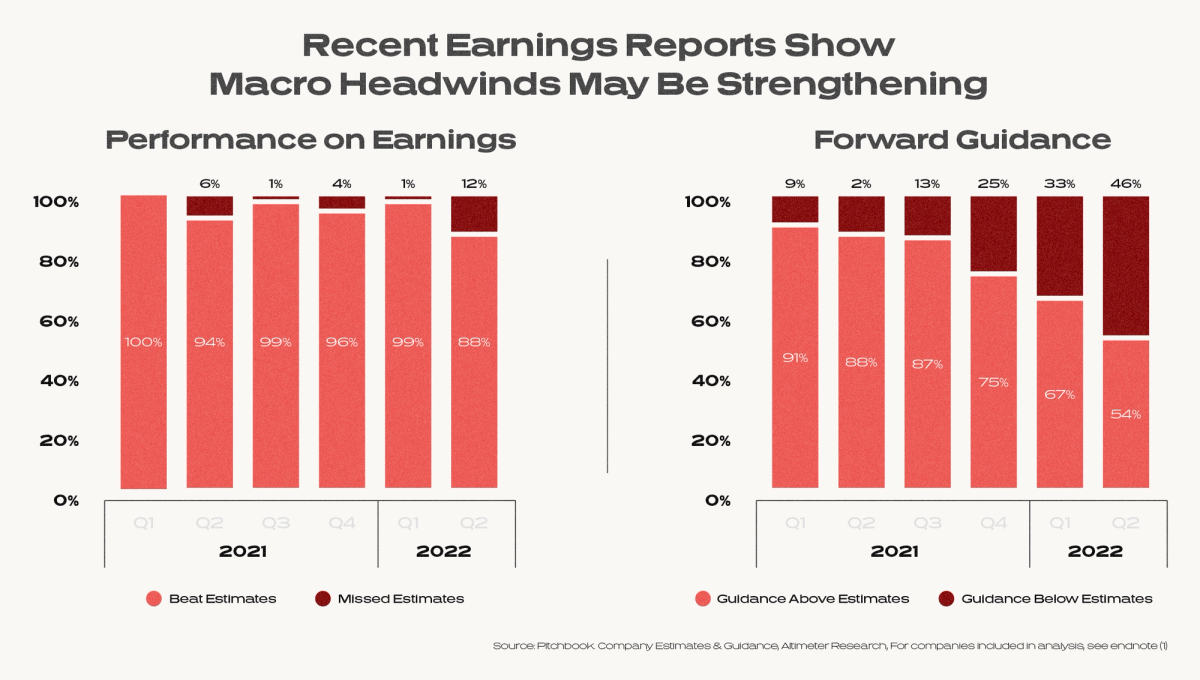
Looking Forward
As the year nears its close, companies are collectively tackling budget planning for 2023. While it’s hard to predict how macro trends will evolve, our analysis suggests that headwinds may be accelerating. The trends around earnings reports of public SaaS companies shows that while companies are largely still performing to expectations, there is increasing weakness in expectations around future growth.
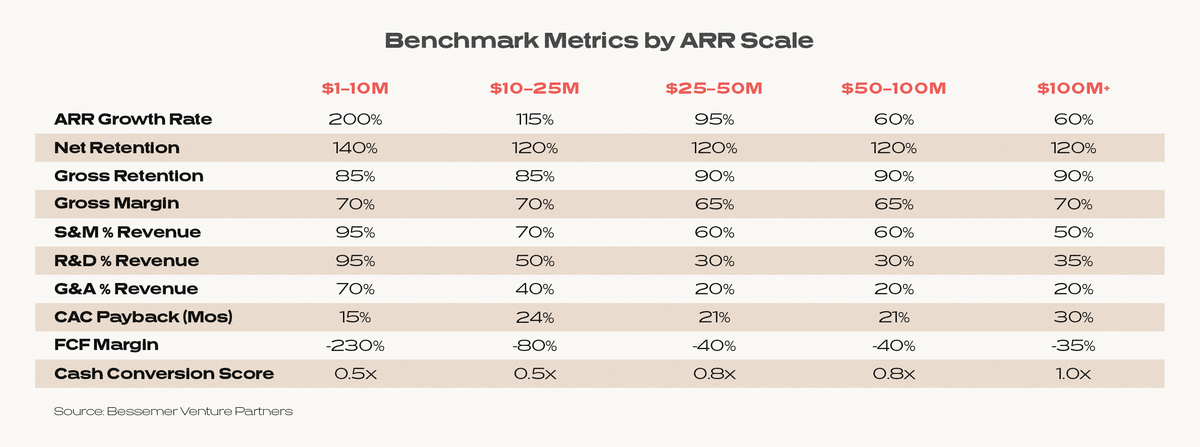
Benchmarks To Strive For
In an uncertain macro environment, the most companies can do is manage internal metrics and strive to reach best-in-class benchmarks. The best-in-class SaaS businesses have strong PMF, which gets reflected in both growth and efficiency metrics. Investors look for and will be looking for businesses with repeatable sales motions and sticky products (that expand over time) in massive markets. What does that translate to in terms of SaaS metrics? How do the best software businesses scale from $0 to $100M+ in ARR?
Companies should actively benchmark their SaaS metrics to the below data (collected by our friends at Bessemer in their “Scaling to $100 Million” report):
Core Takeaways
Depending on how your company is performing against the above metrics, adjusting budgets and priorities will be essential for companies as we enter into this uncertain economic outlook. Management teams will need to show financial discipline to investors and set realistic goals. Companies should employ strategies to extend runway and / or optimize their spend. Prioritizing efficient growth over growth at all costs will be important for the longevity of your business.
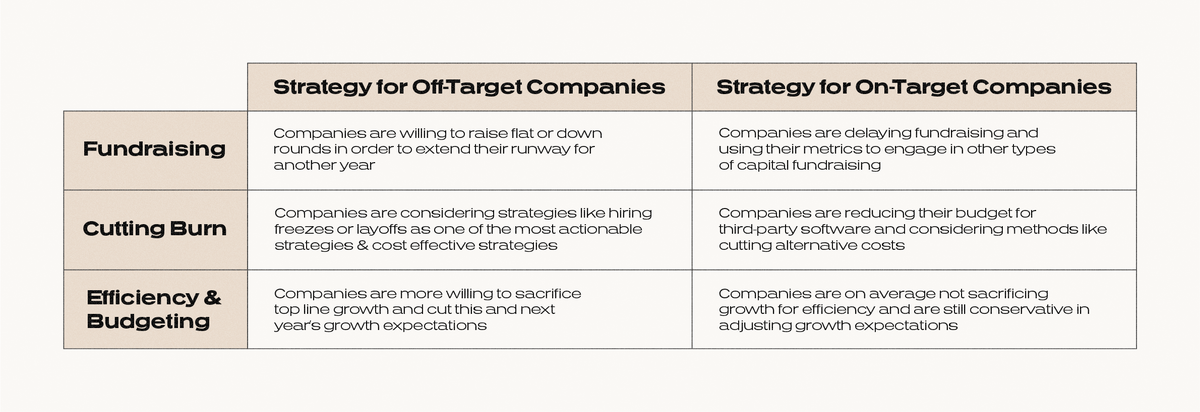
Companies performing to plan can for the most part continue their course while looking for opportunities for efficiency gains. This set of companies should look to optimize their budget for third-party software and delay fundraising, while continuing to grow quickly and take market share. On the other hand, if your company is behind plan, then look to more aggressive cost-cutting and budget-preserving alternatives like hiring freezes and layoffs. Priority #1 should be staying alive. Perhaps entertain taking on additional capital at a price close to your last round to extend runway. Financial discipline will be key. Buying more time will allow underperforming companies to refine their product and strengthen their position in the market.
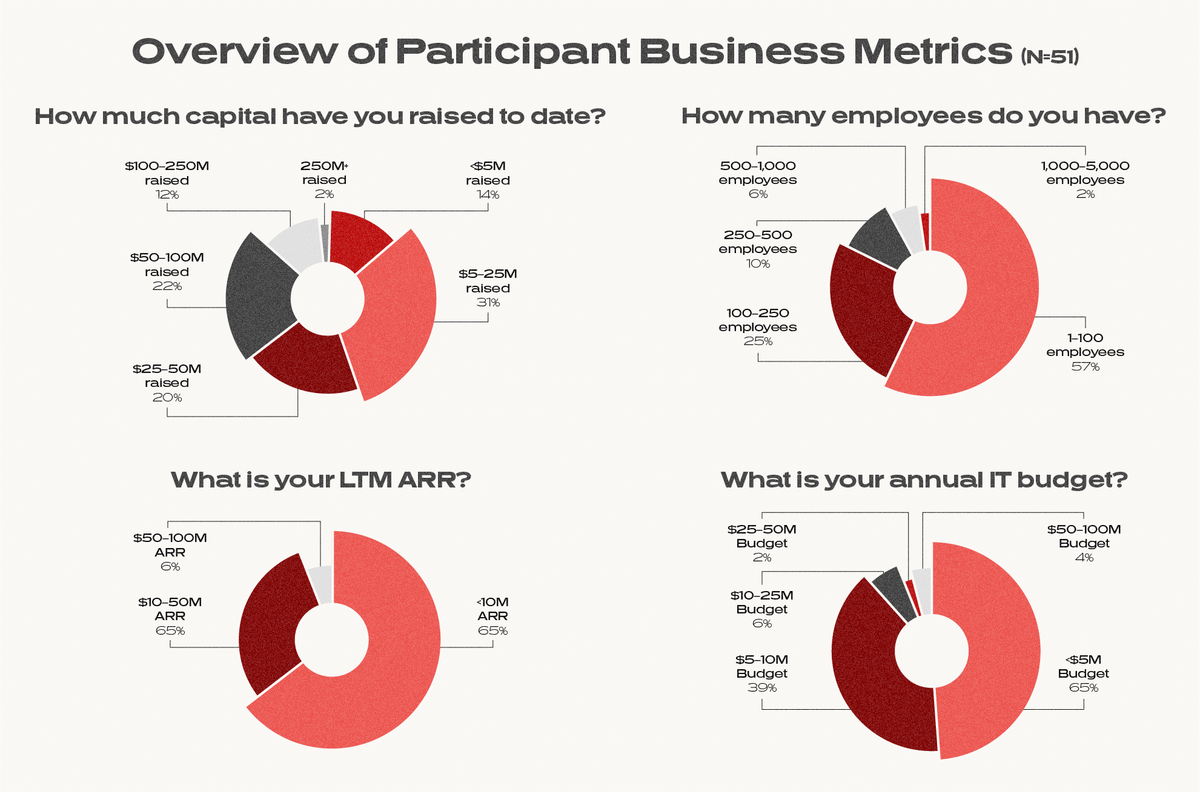
Appendix: Survey Demographic Details
Survey respondents consists of 50 venture backed startups in the Series A - Series D stage. Survey respondents were finance decision makers (either CFO or in some cases, Founder / CEO) and breakdown across capital raised, employee count, and scale, and IT budget are as follows.
Endnotes
- Companies in this analysis include - Alteryx, Bill.com, Paylocity, Zscaler, Hashicorp, Atlassian, Fastly, Monday.com, Paycom, Gitlab, MongoDB, ZoomInfo, Guidewire, SentinelOne, Procore, Samsara, Splunk, nCino, Sumo Logic, Cloudflare, Confluent, Amplitude, Datadog, Crowdstrike, Braze, Digital Ocean, Five9, Elastic, Docusign, Snowflake, Jfrog, Asana, PagerDuty, Box, Okta, Qualtrics, Workiva, Q2 Holdings, Coupa, Twilio, Yext, RingCentral, Smartsheet, BlackLine, Freshworks, New Relic, Dynatrace, Zuora, Veeva, BigCommerce, Salesforce, Hubspot, Wix.com, Domo, WalkMe, Zoom, Benefitfocus, Olo, UiPath